Gold to Silver Ratio Explained: What It Is, Why It Matters, and How Stackers Use It
By Justin · Published · Updated
The gold to silver ratio is one of the oldest financial metrics in human history, and one of the most useful tools for precious metals investors today. Here's everything you need to know.
Quick Answer
The gold to silver ratio measures how many ounces of silver equal one ounce of gold. Calculate it by dividing the gold price by the silver price. Stackers use it to gauge whether gold or silver is relatively undervalued at any given time.
See also: Constitutional Silver Guide · Platinum vs Palladium Guide · Best Precious Metals Portfolio Trackers
What Is the Gold to Silver Ratio?
The gold to silver ratio tells you how many ounces of silver it takes to buy one ounce of gold. That's it.
To calculate it, divide the current gold price by the current silver price.
Gold Price ÷ Silver Price = Gold to Silver Ratio
If gold is trading at $5,000 per ounce and silver is at $100 per ounce, the ratio is 50:1. That means 50 ounces of silver equals the value of one ounce of gold.
When the ratio is high, silver is cheap relative to gold. When it's low, silver is expensive relative to gold (or gold is cheap relative to silver).
Simple concept. But the implications run deep.
A Brief History of the Ratio
The gold to silver ratio is ancient. We're not talking decades or centuries. We're talking millennia.
Ancient Egypt (3200 BCE): King Menes set one of the earliest recorded ratios at 2.5:1. Silver was nearly as valuable as gold because Egypt had abundant gold from Nubia but limited silver access.
Roman Empire (46 BCE): Julius Caesar fixed the ratio at around 12:1, which became the standard throughout the empire. This roughly reflected how often each metal appeared in the earth's crust and how difficult each was to mine.
Medieval Period: The ratio stayed remarkably stable between 12:1 and 15:1 across Europe for centuries. International trade required consistency.
United States (1792): The Coinage Act set the official ratio at 15:1, establishing the backbone of America's bimetallic monetary system where both gold and silver backed the currency.
20th Century: When governments abandoned metal-backed currencies, the ratio started floating freely based on market forces. It's been volatile ever since, swinging from lows around 30:1 to highs above 100:1.
COVID-19 Pandemic (March 2020): The ratio hit an all-time high of nearly 125:1 as investors rushed into gold while silver's industrial demand collapsed during lockdowns.
2025-2026: After that extreme, silver staged a historic comeback. The ratio compressed dramatically as silver outperformed gold by a wide margin.
The key insight? For most of human history, the ratio stayed between 10:1 and 16:1. The wild swings we see today are a modern phenomenon, and they create opportunities.
Why the Ratio Matters to Stackers
Most people who buy physical gold and silver aren't day traders. They're stackers: people building long-term positions in precious metals for savings, wealth preservation, or insurance against economic uncertainty.
For stackers, the gold to silver ratio answers a practical question: Should I be buying more gold or more silver right now?
Here's the logic:
When the ratio is high (say, 80:1 or above): Silver is historically undervalued compared to gold. Some stackers favor silver purchases during these periods, betting the ratio will eventually compress toward historical norms.
When the ratio is low (say, 50:1 or below): Silver has gained significant ground against gold. Some stackers shift toward gold purchases, locking in the relative gains silver has made.
This isn't about timing the market perfectly. It's about having a framework for making decisions when you're adding to your stack over months or years.
How to Use the Ratio in Practice
There are a few common approaches stackers take:
Track the Ratio Over Time
Knowing where the ratio sits today only helps if you know where it's been. The 20th and 21st century average hovers around 60:1 to 70:1. Anything significantly above that range suggests silver may be undervalued. Anything significantly below suggests the opposite.
Set Personal Thresholds
Some stackers set rules for themselves: "If the ratio goes above 80:1, I'll focus my next few purchases on silver. If it drops below 50:1, I'll focus on gold." These aren't magic numbers. They're decision-making tools that remove emotion from the equation.
Consider Your Current Allocation
The ratio can also help you think about balance within your stack. If you hold 90% silver and 10% gold by value, and the ratio is extremely low (meaning silver is relatively expensive), it might be a natural time to diversify toward gold. The reverse applies when the ratio is high.
Don't Obsess
The ratio is a tool, not a religion. Plenty of stackers ignore it entirely and focus on total ounces acquired over time. That's a perfectly valid approach too. The best strategy is one you'll actually stick with.
What Moves the Ratio?
Understanding what drives the ratio helps you interpret what it's telling you.
Safe-Haven Demand: During economic crises, investors often rush to gold first. It's the default "flight to safety" asset. Silver gets left behind initially, pushing the ratio higher. This explains the spike in March 2020.
Industrial Demand: Silver has significant industrial applications: electronics, solar panels, electric vehicles, medical devices. When the economy is growing and industrial production is strong, silver demand increases, which can compress the ratio.
Investment Flows: When precious metals gain attention from retail and institutional investors, silver often sees bigger percentage moves than gold. It's a smaller market, so capital flows have outsized effects.
Mining Supply: About 70% of silver is produced as a byproduct of mining other metals like copper and zinc. This means silver supply doesn't respond quickly to price changes. Gold mining, by contrast, is more direct. Supply dynamics affect each metal differently.
Market Psychology: Silver is sometimes called "the poor man's gold." When optimism about precious metals runs high, silver attracts speculative interest and can outperform dramatically. When sentiment sours, it can underperform just as dramatically.
Common Misconceptions
"The ratio should return to 15:1 because that's the natural occurrence in the earth's crust."
This argument sounds logical but ignores reality. Industrial consumption, recycling rates, central bank holdings, and investor behavior all matter more than geological ratios. The 15:1 ratio made sense when governments fixed it. In a free market, supply and demand set the price.
"A high ratio means silver is about to explode."
Maybe. Maybe not. The ratio can stay elevated for years. It's a tool for thinking about relative value, not a prediction machine.
"The ratio tells you which metal will perform better."
Not exactly. It tells you which metal is relatively cheap or expensive compared to the other. Both could go up, both could go down. The ratio just helps you think about the relationship between them.
The Ratio and Your Portfolio
Most financial advisors suggest precious metals should represent 5% to 10% of a diversified portfolio. Within that allocation, the gold to silver ratio can help you decide how to split between the two metals.
There's no single right answer. Some investors prefer the stability and liquidity of gold. Others prefer silver's lower price point and higher upside potential. Many hold both.
What the ratio offers is a data point, one piece of information to factor into your decisions alongside your own goals, risk tolerance, and beliefs about where the economy is headed.
Tracking Your Gold to Silver Ratio
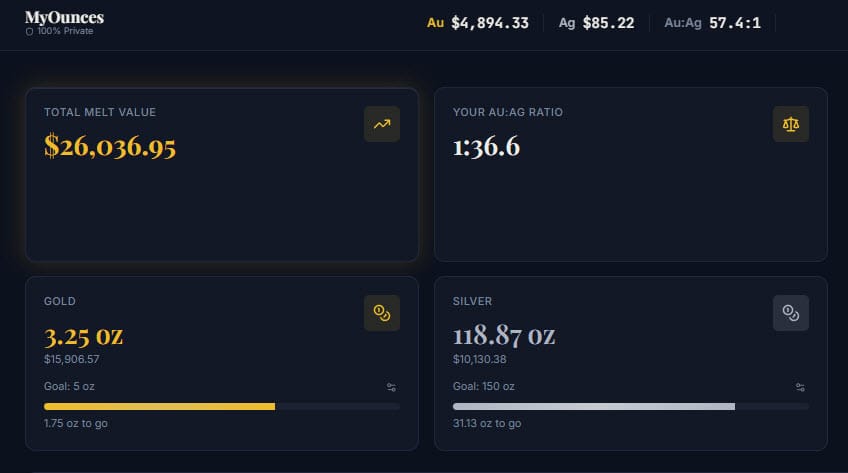
If you own both gold and silver, you have your own personal gold to silver ratio within your stack.
Say you own 10 ounces of gold and 500 ounces of silver. Your ratio is 50:1 (500 ÷ 10). If the market ratio is 60:1, you're holding proportionally more silver than the market average. Whether that's good or bad depends on your outlook.
Tracking this over time helps you understand your allocation and make informed decisions about future purchases.
Tools like MyOunces show your personal Au:Ag ratio automatically alongside your portfolio's melt value. No spreadsheet required.
Frequently Asked Questions
What is a good gold to silver ratio?
There's no universally "good" ratio. It depends on your perspective. Historically, ratios below 50:1 favor gold purchases (silver is relatively expensive), while ratios above 80:1 favor silver purchases (silver is relatively cheap). The long-term modern average sits around 60:1 to 70:1.
What is the gold to silver ratio right now?
The ratio changes constantly as gold and silver prices fluctuate throughout the trading day. To find the current ratio, divide today's gold spot price by today's silver spot price. Many precious metals websites display this in real time.
Should I buy gold or silver based on the ratio?
The ratio is one factor to consider, not the only factor. Your decision should also account for your existing holdings, storage constraints, budget, and personal outlook on each metal. Some stackers ignore the ratio entirely and buy consistently regardless. Others use it as a guide for tilting purchases one direction or the other.
Why did the gold to silver ratio spike so high in 2020?
During the initial COVID-19 panic in March 2020, investors flooded into gold as a safe-haven asset while silver's industrial demand collapsed due to factory shutdowns. Gold prices surged while silver lagged, pushing the ratio above 120:1, an all-time high.
Can the ratio predict future prices?
No. The ratio tells you about relative value between the two metals, not absolute direction. Both metals could rise, both could fall, or they could move in opposite directions. The ratio is a tool for thinking about allocation, not a forecasting model.
Why is the gold to silver ratio so high?
The ratio tends to be elevated when gold outperforms silver, which often happens during economic uncertainty. Gold attracts safe-haven demand first while silver's industrial demand can weaken. The ratio has stayed above historical averages for most of the 21st century due to shifting monetary policy, reduced silver mining output, and persistent macroeconomic uncertainty.
Key Takeaways
The gold to silver ratio measures how many ounces of silver equal one ounce of gold. Calculate it by dividing the gold price by the silver price.
Historically, the ratio stayed between 10:1 and 16:1 when governments fixed it. In modern free markets, it's ranged from around 30:1 to over 120:1.
A high ratio suggests silver is relatively undervalued. A low ratio suggests the opposite.
The ratio is a decision-making tool, not a crystal ball. Use it alongside your own goals and judgment.
Understanding your personal gold to silver ratio (how much of each metal you actually own) helps you make smarter stacking decisions over time.
This article is for educational purposes only and does not constitute financial advice. Always do your own research before making investment decisions.
Last updated: March 24th, 2026